Working with automation gives you a real-life impression to manage and track your work. It’s certain that all stakeholders need crucial information on performance and insights. But, making it accessible & actionable is a big challenge.
For this, you need to have the right kind of information at the right time to be served to the right hands. This is how you can make better & quick decisions on data. Creating your own smartsheet, and adding extraordinary features that automatically produce editable charts on that sheet to the dashboards is no magic. With data science services & automation in place, you can do it in no time.
But, making decisions is a little bit tough.
Let’s get through how real-time data-based dashboards can help.
- Transparency into real-time information
Smart dashboards are architected to gain visibility when the work is in progress. Even if your work is unique, you don’t need to have pre-built dashboards. The automated system can customise it with easy tips and tricks that are commonly used in AI. Even, you can have some widgets that deliver great flexibility to adapt to any platform without needing any IT professional or coder.
With widgets, you have the opportunity to get real-time details from where you want. With some advanced tweaks, you can translate your sheet into a linkable tool for bridging gaps in tracking projects in different ways. If you want to see information from individual cells, it turns accessible.
Moreover, embedding a report that shows the latest status of the work is no big deal with a widget. In addition, you can make it richer with the text, titles, attachments, and images that need to be there for understandability.
What a more interesting fact is that you don’t need to redo for creating a report. The advanced smart sheets are designed to fetch and update the dashboard straight away when it is put in the original source of data. Simply put, you gain visibility into what has been done and making decisions becomes easier.
2. Visualisation assists in quick analysis
Timely decision matters a lot. With a massive ton of messy data, you cannot expect quick analysis.
What if the data is visualized?
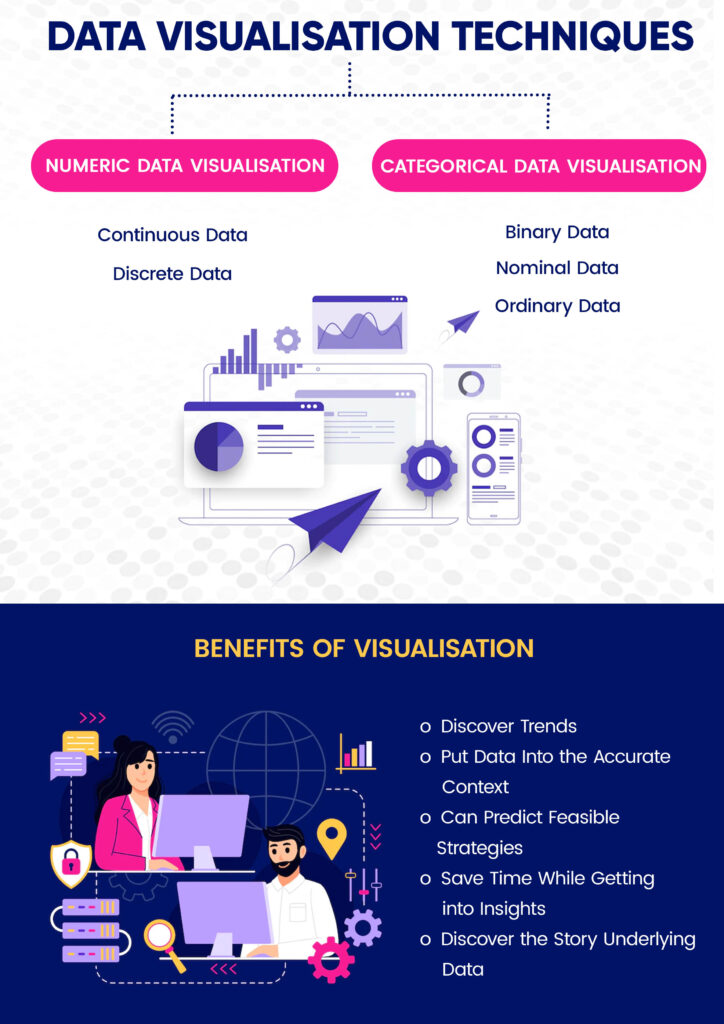
Certainly, it’s the best way to make decisions swiftly. Visualisation makes a graphical presentation that anyone can understand upon spending a few minutes with it. It helps you to cut through the noise and spot trends in a wink.

That’s why the real-time data-based sheets are integrated with some advanced features that can quickly convert complex data into a visible format, which is easy to read and understand. Data science enables programmers and MIS experts to use simple widgets for selecting chart types, such as bars, columns, lines, or pie. These charts get real-time feeds from sheets so that the analysis would be quick and strategizing would be way faster.
3. Dashboards display the real performance
From CEO to sales manager to program manager, every authority wants to see what’s going on in its workflow hierarchically. One wants to share pipeline activities and also, wants to see them from the perspective of future. That’s why smart dashboards are designed.
These dashboards show the real insights that any manager or authority can assess accurately in real-time. One can compare the current spending on strategic objectives, track budgets and actual expenses, visualize the status of the work, and a lot more things in one place.
The organizations that are deploying AI to access real-time insights effortlessly stay on top of the world. It’s simply because they don’t have any missing information to compromise on. From key project metrics to statuses, the competent manager can see everything in real-time.
4. Access details exactly when you need
Getting information before it turns out obsolete is important. No matter what your role is in the organization. You need to have the right information at the time when you need access. With smart dashboards, you can catch up with any detail from any department in just a few clicks. This is how you will be able to track down relevant data and make timely decisions.
In the essence, it’s necessary to tap into the trending data science tools and technologies and integrate them if you really want to get ahead. Time is real money and if you have any crucial information in time, beating the clock and setting trends would be easier than ever.
