

How Can You Draw Business Intelligence Structure?

Business intelligence (BI) refers to a structure where various technologies are deployed to run business intelligence. Since it’s about intelligence, analytics appears in the main role.
Certainly, this is a whole sole process, which involves IT systems, software, or applications that can help in collecting, integrating, storing, and analyzing drawn strategies or decisions. Then, these are validated.
So, the BI structure is key to unlocking successful business processes. This success is defined through deep analysis, timely reporting of the tracked performance & optimized processes. You have to identify new opportunities and improve strategic planning. Finally, making informed decisions becomes easier.
Why is BI Structure Important?
This structure emphasizes the technology standards, effective data management, and deep analytics practices to assist in drawing feasible decisions. Later, these are tested, and the validated decisions are implemented with resources.
Since the strategy is to be made, you have to collect relevant details and organize and manage them properly. This practice helps in drawing exactly what you are looking for via analysis. For stakeholders, its understanding is significant. So, you can use data visualization like Tableau tools or data studio to represent all findings in an easy-to-understand manner.
If your BI structure is strong, it would certainly go along with the governing policies like GDPR, which prevents sharing of sensitive data.
Once drawn, the engaged team coordinates ethically to build a BI-driven program for achieving desired goals. Certainly, this architecture can better your business operations, team efficiency, overall revenues, etc.
This impressive internal BI structure of any enterprise can help in leveraging insights and making fact-driven decisions for substantial growth and overwhelming ROI. This is the best part of business intelligence services.
This whole structure can be created through creative business managers, C-suite executives, and stakeholders. Together, they can get deep with data analysis to form strategies or decisions that are feasible and profitable.
How Can You Draw Business Intelligence Structure Using its Components?
The business intelligence structure can be deployed on-site or in the cloud. For both, you require some must-have components that can let different stages of this process go on smoothly.
So first, you should think about target processes and then, collect data to integrate with a server for analysis and data visualization. Then only, you can filter strategy patterns for different applications.
Let’s get through which components you need for it.
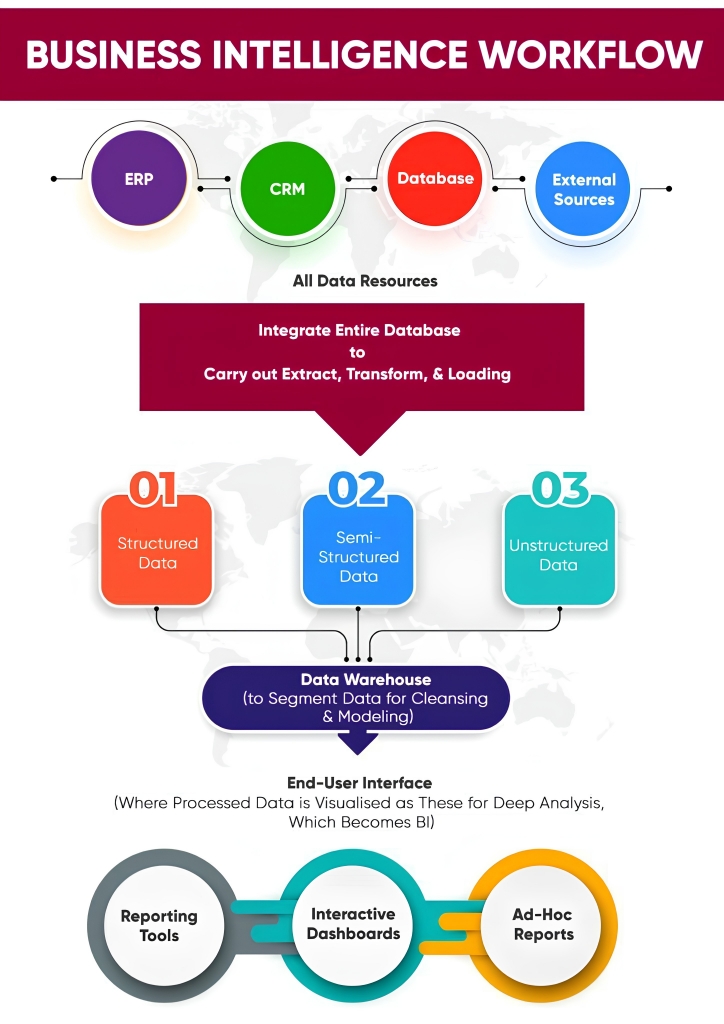
- Data Sources for Collecting Datasets
For any decision, you should have facts. Here, you should have the data repository or database of a specific department like sales, marketing, operations, etc. This source can help you to collect information for further processing.
Basically, the web-based sources can be ERP, CRM, Inventory Management systems, or any other one corresponding to the line of business.
But if you don’t have your own repository, pool details, or contact lists from third-party sources, which are also called secondary sources.
There is another option for drawing BI structure via datasets, which is a hybrid system. It allows you to wisely integrate the primary data sources with the secondary sources for BI architecture.
Guidelines to Follow
- Select data as per relevancy, validity, data quality, geography, and the categories of details available.
- Combine them all for cleaning or bringing similarity to the structure.
- Data Integration and Cleansing for Uniform Records
For accurate and next-level decision-making, you need hybrid source data. For this, you may integrate primary data and information from secondary resources. Here, the concept of the Extract, Transform, & Loading (ETL) process can help. It’s extremely helpful in data mining and AI creation. You may rely on it for extracting data from various competitor websites.
Later, run the cleansing process. You may remove typos, inconsistencies, dupes, oddities, outliers, & normalize details using the data enrichment method. Once all files are integrated and uniform by structure, load for getting into insights. For these processes, you may deploy scripts, tools, or applications. Even, real-time analytics applications are also available like Data Studio, Tableau, etc. which visualize the collected data from sources for easy analysis. It can help in defining BI structures.
These tools can automatically run data profiling and cleansing in no time. This is how the data management teams can have big support for backing business intelligence structuring.
Guidelines to Follow
- Choose the ETL that can easily connect with source systems.
- Ensure seamless data capturing and maintenance of sources.
- Pay attention to its cost, functionalities, and security features.
- Analysis in Data Stores for Intelligence
It involves various databases and repositories where data are pooled and managed effectively. Such virtual places can be data warehouses where structured datasets are available in a relational, columnar, or multidimensional structure for analysis.
If you have multiple departments like sales, digital marketing, OCR conversion, or operations, opt-in data marts. These spaces allow you to keep department-wise datasets.
Besides, you can have an operational data store where all internal databases of your organization can merge together for analytical queries in real-time.
For large enterprises, Hadoop like data-lake can be a better option for collecting and keeping raw data of various types. The sweet spot of using it is that it itself filters & loads records for analysis.
Guidelines to Follow
- Defining what to analyze.
- Get support from the collected data.
- Run SWOT analysis.
- Embrace failure.
- Summarize findings.
- Data Visualization Apps or Tools
These are really effective and must-have tools to make analysis easier. You may integrate them into a business intelligence structure in no time because of their flexible and advanced settings. A few of them are ad hoc queries, data mining software, online analytical processing via customized scripting or OLAP, applications, etc.
This is how the analysts and stakeholders can seamlessly run queries themselves without needing data scientists or BI specialists.
For visualization of any datasets, you can use charts, graphs, line graphs, etc. for converting messy data into a beautiful and comprehensive picture. This is how you can easily draw trends, or decision patterns using visuals in no time.
Guidelines to Follow
- Connect with specific domain experts for visualization.
- Choose the right visual for better presentations.
- Provide context in terms of meaning.
- Keep your presentable simple & digestible.
- Let it be engaging.
- Reports for Making Decisions
This is the last component that infuses visibility into the results. If you have built-in visualization features, it would be an add-on. You may easily design and assess data in real-time.
You can have reporting tools in places like Office 365, ProWorkflow, or Google Data Studio to generate impressive & expressive reports automatically in a desirable format.
Guidelines to Follow
- Ensure it is able to visualize data.
- Drag–and–drop reporting should be there.
- Interactive reporting dashboards are available.
- If possible, consider live-reporting tools for real-time reporting.
- Integration support should be available.
- Easy-to-customize features will be a plus.
All of these tools and methods or components help in drawing an effective business intelligence structure.
Areas Where BI Structure Can Be Effective
Sales, marketing, finance, accounting, operations, etc. are the internal processes that must have BI to support decision-making. All of these areas are vital and helpful in keeping an event up and running through business intelligence services.
Conclusion
To draw business intelligence, one should have all components. These are tools or software for data collection like CRM, data cleansing like typos, dupes, or outliers, analyzing data, visualizing every set as per requirement, and reporting. This is how business intelligence can be structured easily & effectively.


.jpg)
Post Comment
Your email address will not be published. Required fields are marked *